Dashboards
Dashboards
Create real-time visualization dashboards for your IoT data
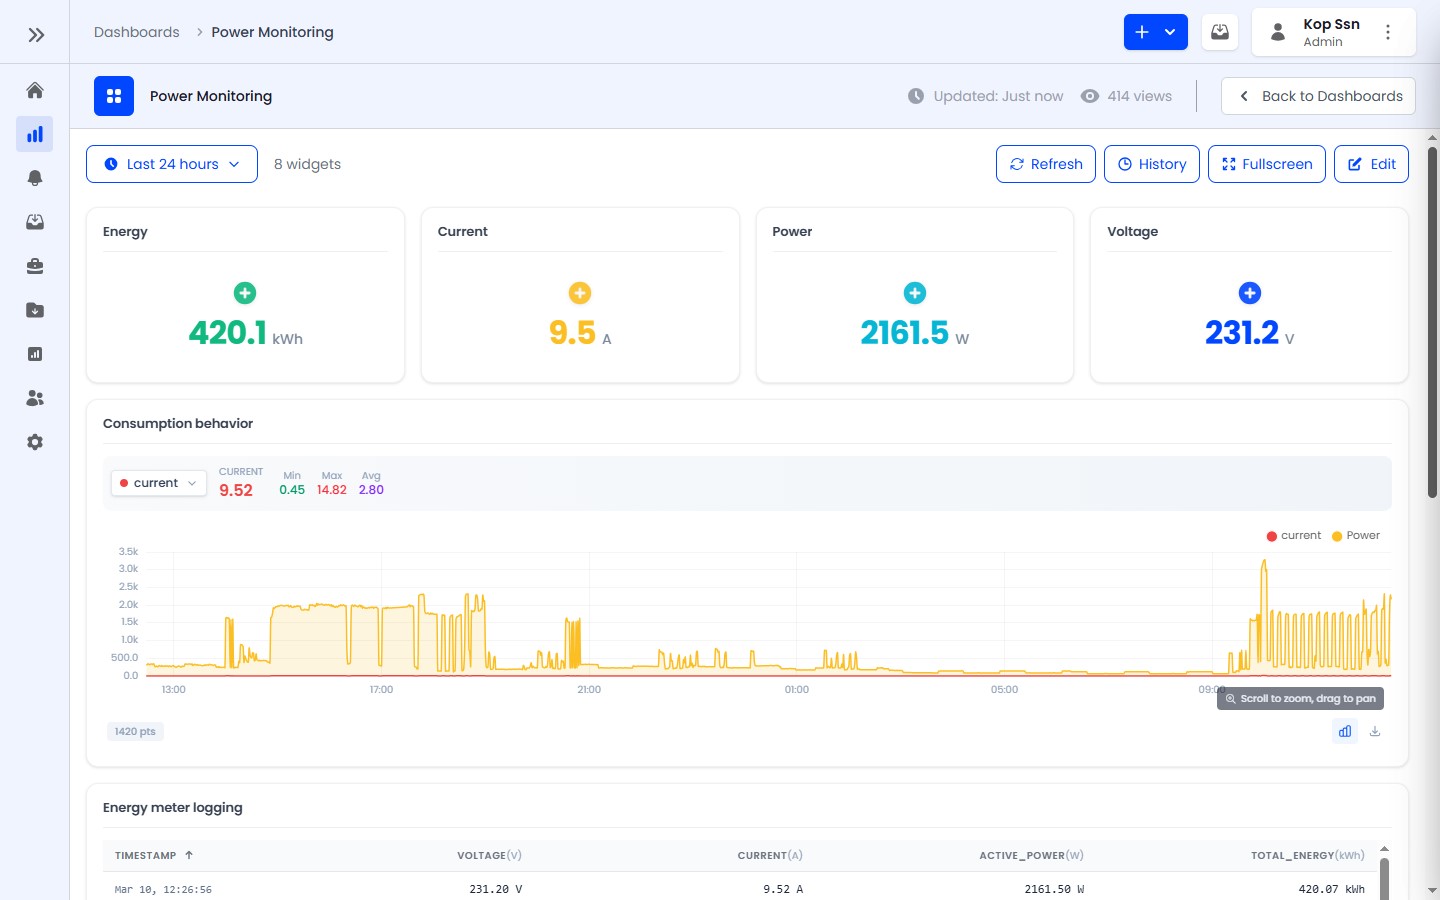
Dashboards are customizable visualization pages for monitoring IoT data in real-time. They support drag-and-drop widget placement, resizing, and live data streaming.
Key Features
- 12-column responsive grid layout for flexible widget arrangement
- Drag-and-drop positioning in edit mode
- Real-time data updates via WebSocket
- Eight widget types for different visualization needs
- Collapsible widget config sections for a cleaner editing experience
- Time window selection from 5 minutes to 30 days, plus real-time mode
- Fullscreen viewing mode for monitoring displays
- User assignment to control crew access
- Star/favorite dashboards for quick access
Widget Types
| Widget | Best For |
|---|---|
| Value Card | Single metrics (temperature, battery level) |
| Gauge | Range values with thresholds (pressure, fill level) |
| Line Chart | Time-series trends (temperature over time) |
| Bar Chart | Time-bucket totals and device/metric comparisons |
| Table | Multi-field overview (device status summary) |
| Indicator | Discrete state and connectivity status lights |
| Toggle | Device controls (light switch, relay) |
| Timeseries Table | Historical data logs with CSV export |
Access by Role
- ADMIN - Can create, edit, and delete all dashboards in the tenant
- ENGINEER - Can view and create dashboards, but cannot delete them
- USER - Can view assigned dashboards (read-only), interact with toggles