Dashboards
Creating Dashboards
How to create, configure, and manage dashboards in Sensorclouds
Creating a Dashboard
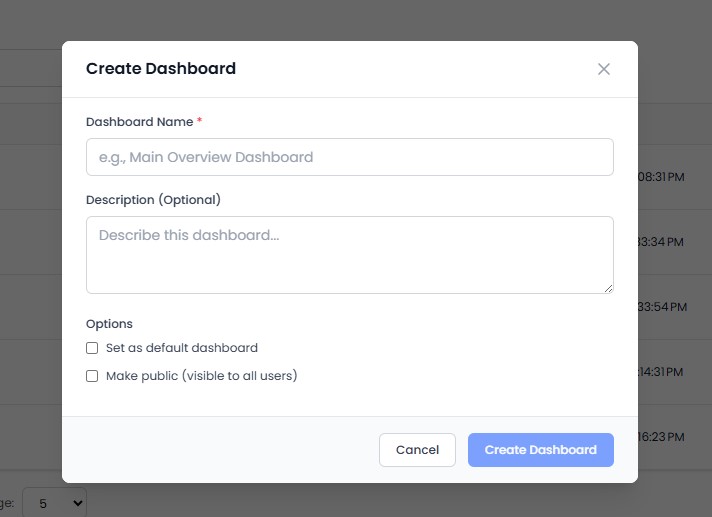
Navigate to Dashboards from the sidebar and click Add Dashboard.
Enter a Name and optional Description, then click Save. You will be taken to the empty dashboard canvas.
Adding Widgets
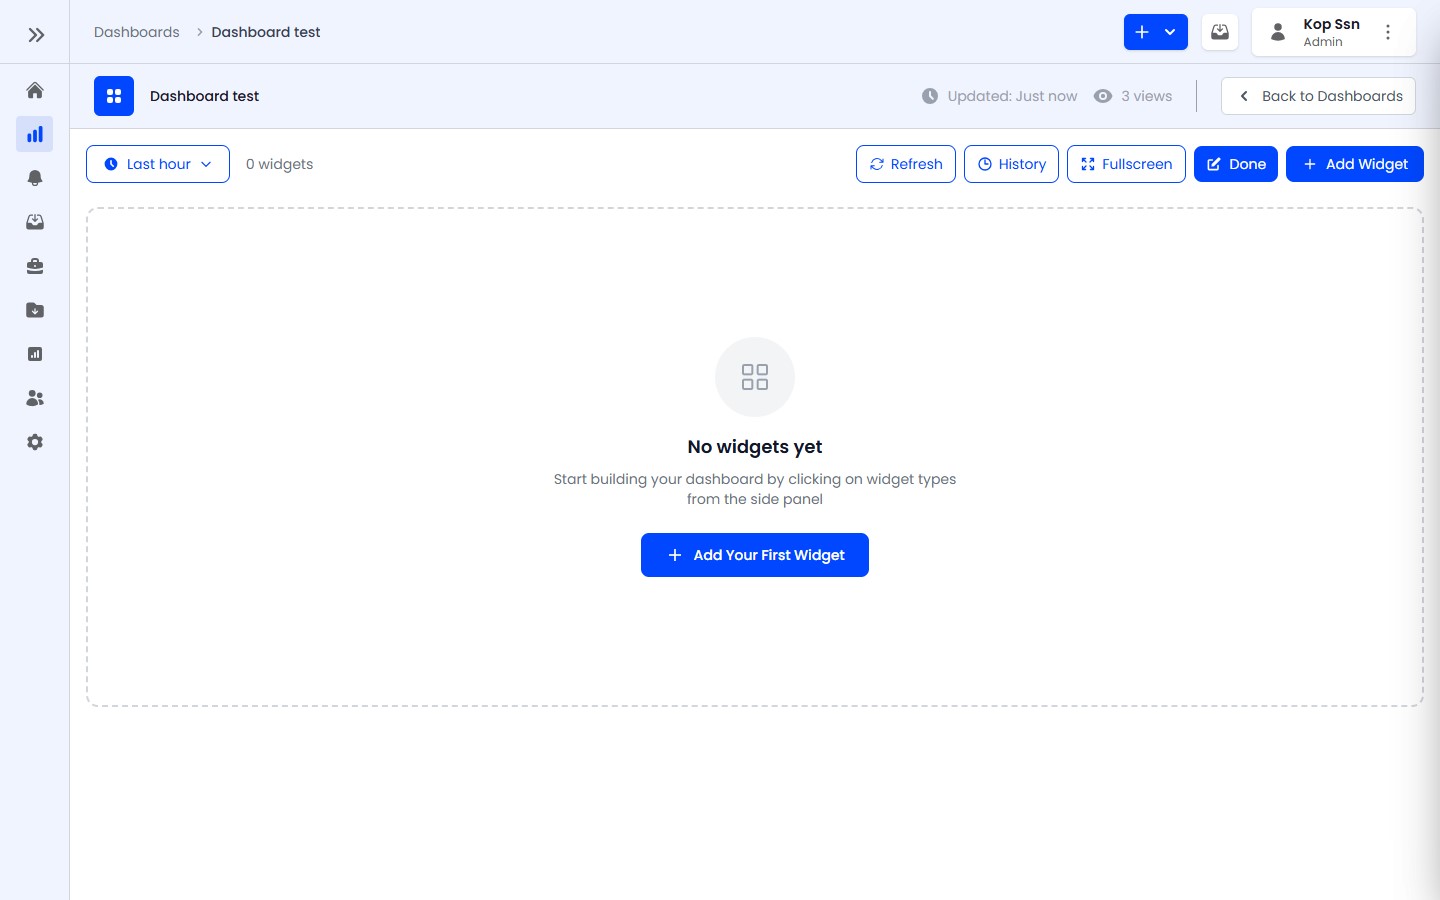
Click Edit Mode in the action bar to enter editing state.
Click Add Widget to open the widget drawer.
Select a widget type and configure it:
- Select the data source (device and telemetry field)
- Set display options (title, units, colors)
- Configure type-specific options (thresholds for gauges, time range for charts)
Click Save - the widget appears on the canvas.
Arranging Widgets
In Edit Mode:
- Move: Drag widgets by the drag handle (top-left corner)
- Resize width: Drag the right edge handle
- Resize height: Drag the bottom edge handle
- Resize both: Drag the corner handle
- Widget size is shown as "columns x rows" (e.g., 4x3)
Duplicating and Deleting Widgets
- Duplicate: Hover over a widget in Edit Mode and click the copy icon
- Delete: Hover over a widget in Edit Mode and click the trash icon
Dashboard Controls
| Control | Description |
|---|---|
| Time Window | Select data range (5m, 15m, 1h, 6h, 24h, 7d, 30d) |
| Real-time Mode | Toggle live WebSocket streaming |
| Refresh | Manually refresh all widget data |
| Fullscreen | Enter distraction-free viewing mode |
| Star | Favorite a dashboard for quick access |