Viewing Telemetry Data
Access live and historical telemetry data in the platform
Live Data Page
The Live Data page shows a real-time stream of telemetry messages as they arrive via WebSocket.
Available at two levels:
- Application level - Shows messages from all devices in the application
- Device level - Shows messages from a single device
New messages appear automatically as they arrive, showing decoded payload fields and values.
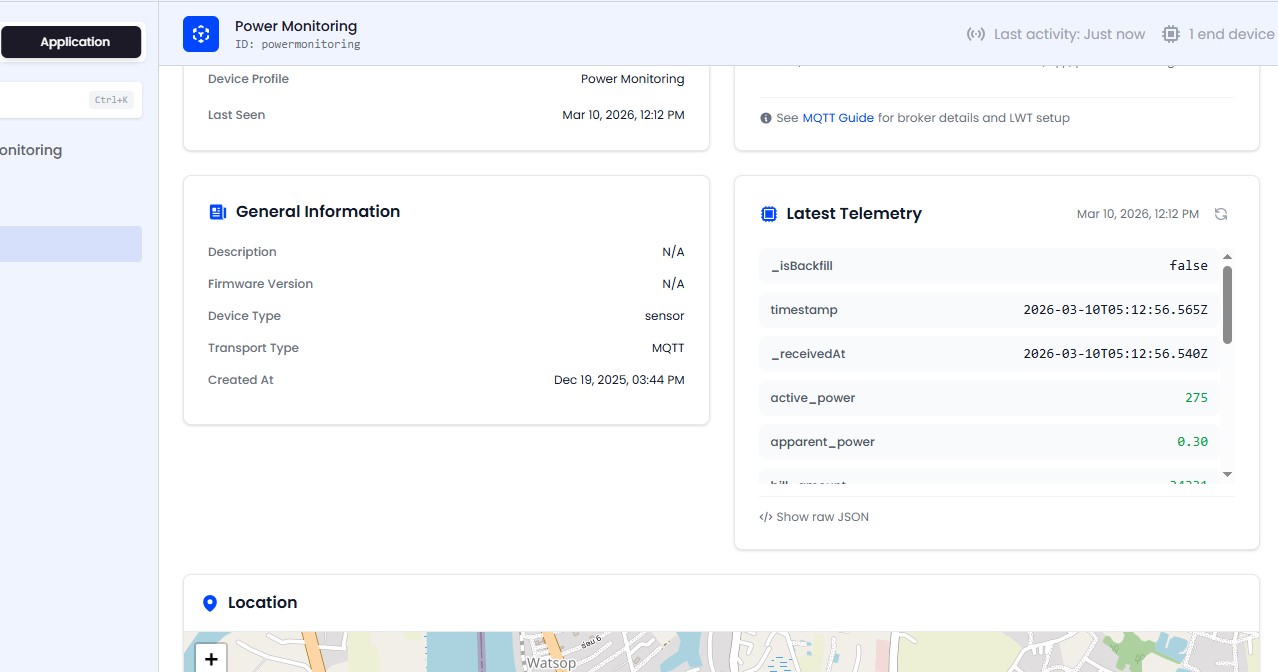
Device Latest Telemetry
On the device overview page, the Latest Telemetry section shows the most recent value for each discovered field.
Features:
- Key-value list of all telemetry fields with their latest values
- Raw JSON toggle for debugging - see the exact payload received
- Refresh button for manual updates
Time Ranges
When querying historical data, you can use preset or custom time ranges:
Presets
-5m, -15m, -1h, -6h, -24h, -7d, -30d
Custom Range
Specify start and end timestamps in ISO 8601 format for precise queries.
Telemetry API
You can pull telemetry programmatically through the read-only external REST API, authenticated with a self-managed API key. It exposes the latest and historical readings for a device.
See API Access for authentication, endpoints, scopes, and examples.